“Without data, you’re just another person with an opinion.” – W. Edwards Deming
The 10-Day Festival of Speed, Culture, and Entertainment
Grand Prix Season Singapore (GPSS) is an annual city-wide celebration that transforms Singapore into a vibrant hub of motorsport-themed activities. Arranged in conjunction with the Formula 1 Singapore Airlines Singapore Grand Prix, GPSS combines high-speed racing with entertainment, cultural options, and gastronomical experiences.
Additional highlights encompass concerts featuring international artists, food festivals, exhibitions, and interactive experiences, making it a must-see event for both residents and tourists. Its 15th edition was held from 13 to 22 September 2024.
Apeiron has been associated with Singapore Tourism Board Market Research since 2023.
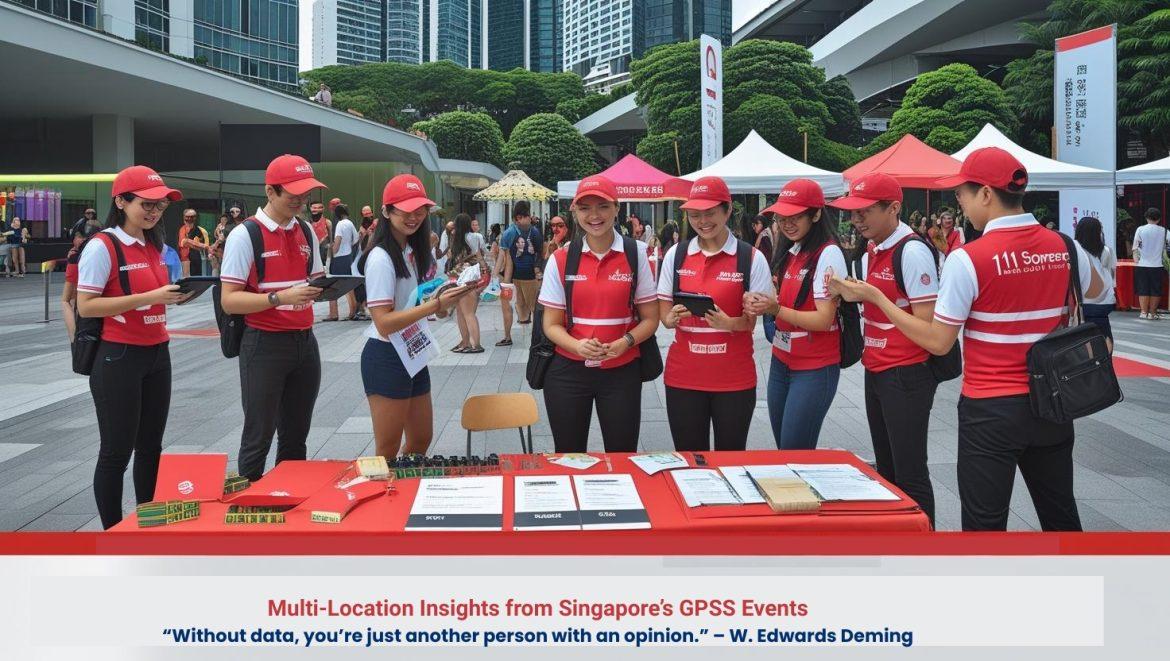
During the GPSS, Singapore’s iconic districts come alive with race-themed activities. From Orchard Road to Clarke Quay, Kampong Gelam, and Sentosa, each precinct has an experience to offer.
The GPSS Events Singapore Analytics was secured by the company Apeiron.
Footfall Analytics measures precinct parties with detailed tracking and analytics. Major activities include assessing the number of people for each of the four precincts, analyzing visitor demographics, and possibly assessing the impact on nearby businesses. Additional metrics will include feedback on customer satisfaction and tracking revenue from the events as well as indirect benefits to nearby businesses. Program partners will be surveyed to ascertain their expectations for an overall business impact of the events. Finally, observations will be drawn from data collected, and recommendations will be prepared for either presentation or reporting to summarize the conclusions.
Get in Touch with Apeiron’s Market Research Experts Now!
Footfall Estimation – Research Methodology
- On-Site Interviews: Event-day foot traffic estimates and survey interviews conducted by field agents stationed both inside and outside event premises.
- Interaction with Participant Surveys: Field agents encourage participants to complete the surveys.
- Manual Count Communication: Consistent communication of the manual counts was done to the desk team for consideration.
- Photographic Collection of Evidence: Photos with time stamps were shared for verification.
- Desk Team Verification: The desk team went through photos to estimate footfall.
- Hourly Count Extrapolation: Collected on an hourly basis (weekday/weekend, inside/outside).
- Footfall Benchmarking: Airports were referenced for benchmarking (2023-2024) at nearby Wisma Atria.
- Data Triangulation: This helped to reduce errors by cross-verifying data to arrive at an estimate of an average daily footfall.
- Estimation of Tourist Ratio: This was calculated on surveys filled by tourists or short-term pass holders.
- Data Collection Period: 10 days for both footfall and survey data.
Consumer Survey – Research Methodology
- Survey Participation: Field agents interacted with event-goers to fill the survey.
- QR Code Survey: Conducted surveys by distributing QR codes for participants to scan and fill.
- Survey Locations: Conducted surveys at the event area and surrounding display locations.
Study Tools for Research
- Footfall Estimation – Digital photography, video analysis, and physical counts constitute an estimation procedure for an accurate measurement of foot traffic.
- Data Extrapolation – Visitor numbers are assessed, and accuracy is enhanced by working alongside participants and neighboring businesses.
- Optimized Location Boundaries – Multiple entry points strategically designed to maximize participation, adjusted for the concerns of safety and site design.
- Study Objective – Seeks to estimate footfall, participant revenue, and customer satisfaction with a view to better event planning.
- Target Locations – Four iconic locations were studied: Orchard Road, Sentosa, Kampong Glam, and Clarke Quay.
- Sample Size – 3,200 respondents surveyed in total, with 800 participants from each location, thus providing a wide variety of data.
Methods of Data Collection:
- Online and physical surveys
- Face-to-face interviews
- QR code and email survey distribution
- Telephone interviews
Ensuring Data Quality:
- Field surveyors under the supervision of team leaders
- Verification via GPS track and time-stamped photos
- Pulse surveys and data reliability tests
- Daily review of collected data for consistency and accuracy.
Definition of Footfall Insights
The Footfall Nexus allows STB to place resources on the ground while fine-tuning event execution processes based on peak visitation times.
- Customer Satisfaction: Provides data to improve visitor experience and address areas for improvement.
- Revenue Tracking: Enables STB to maximize economic benefits and assess the financial impact of events.
- Program Partner Feedback: Guides future partnerships and collaborations for better program outcomes.
- Data-Driven Decisions: Assists STB in tailoring marketing strategies and attracting targeted audiences.
- Event Optimization: Ensures future events are more efficient, enjoyable, and successful for all stakeholders.
- Comprehensive Analyses by Aperion: Guarantee actionable insights that make a difference in both planning and execution of events.
For comprehensive multi-location event analytics, Apeiron Market Research and Consulting invites your consideration.
